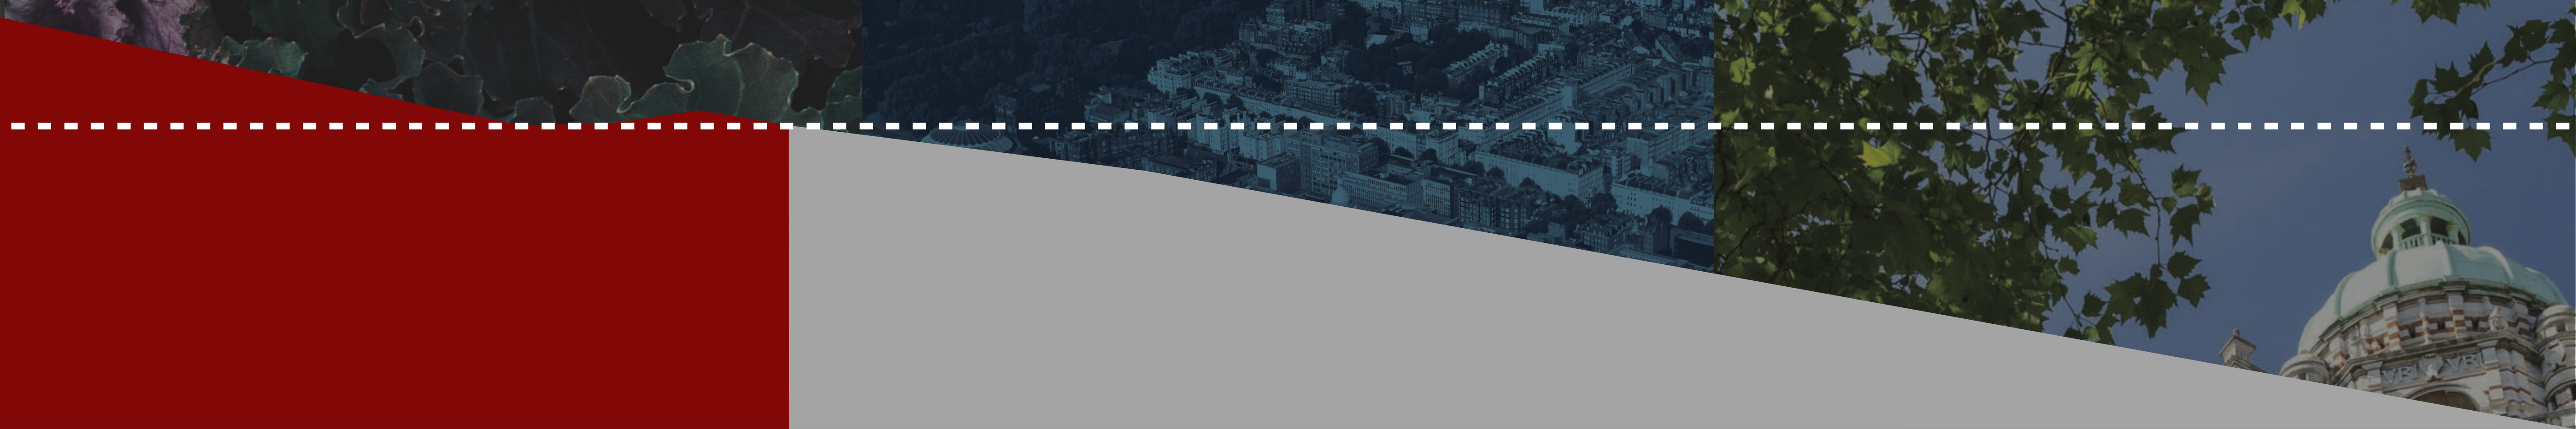
In the 2021/22 academic year, Imperial College London emitted at least 264,344 tCO2e according to their 2022 Carbon Report1. 17% of that is scope 1, 4% is scope 2, and the remaining 79% of Imperial’s emissions are scope 3.
In this article I want to breakdown everything I could find about Imperial’s emissions and their plans.
 Imperial’s emissions in 2021-22. 21% came from scopes 1 & 2, within which 11% from CHP, 6% from gas for heating, and 4% for grid electricity. (From Imperial’s 2022 Carbon Report.)
Quick terminology rundown
tCO2e: tonnes of Carbon Dioxide equivalent. By converting other gases like methane into the amount of CO2 which would have the same warming effect (usually over 100 years), we get one number which covers all greenhouse gas emissions.
Scope 1: Direct emissions - usually burning fuel on site.
Scope 2: Indirect emissions from purchased energy - all emissions from purchased energy (mostly electricity).
Scope 3: Other indirect emissions - other emissions, including emissions to produce goods you use.
Overview
Imperial uses Combined Heat and Power engines (CHP) to produce most of its electricity and heat rather than buying electricity and gas separately from the grid. This means scope 1 emissions are higher than expected and scope 2 emissions are lower. This makes it more useful to consider scope 1 & 2 emissions together in most cases.
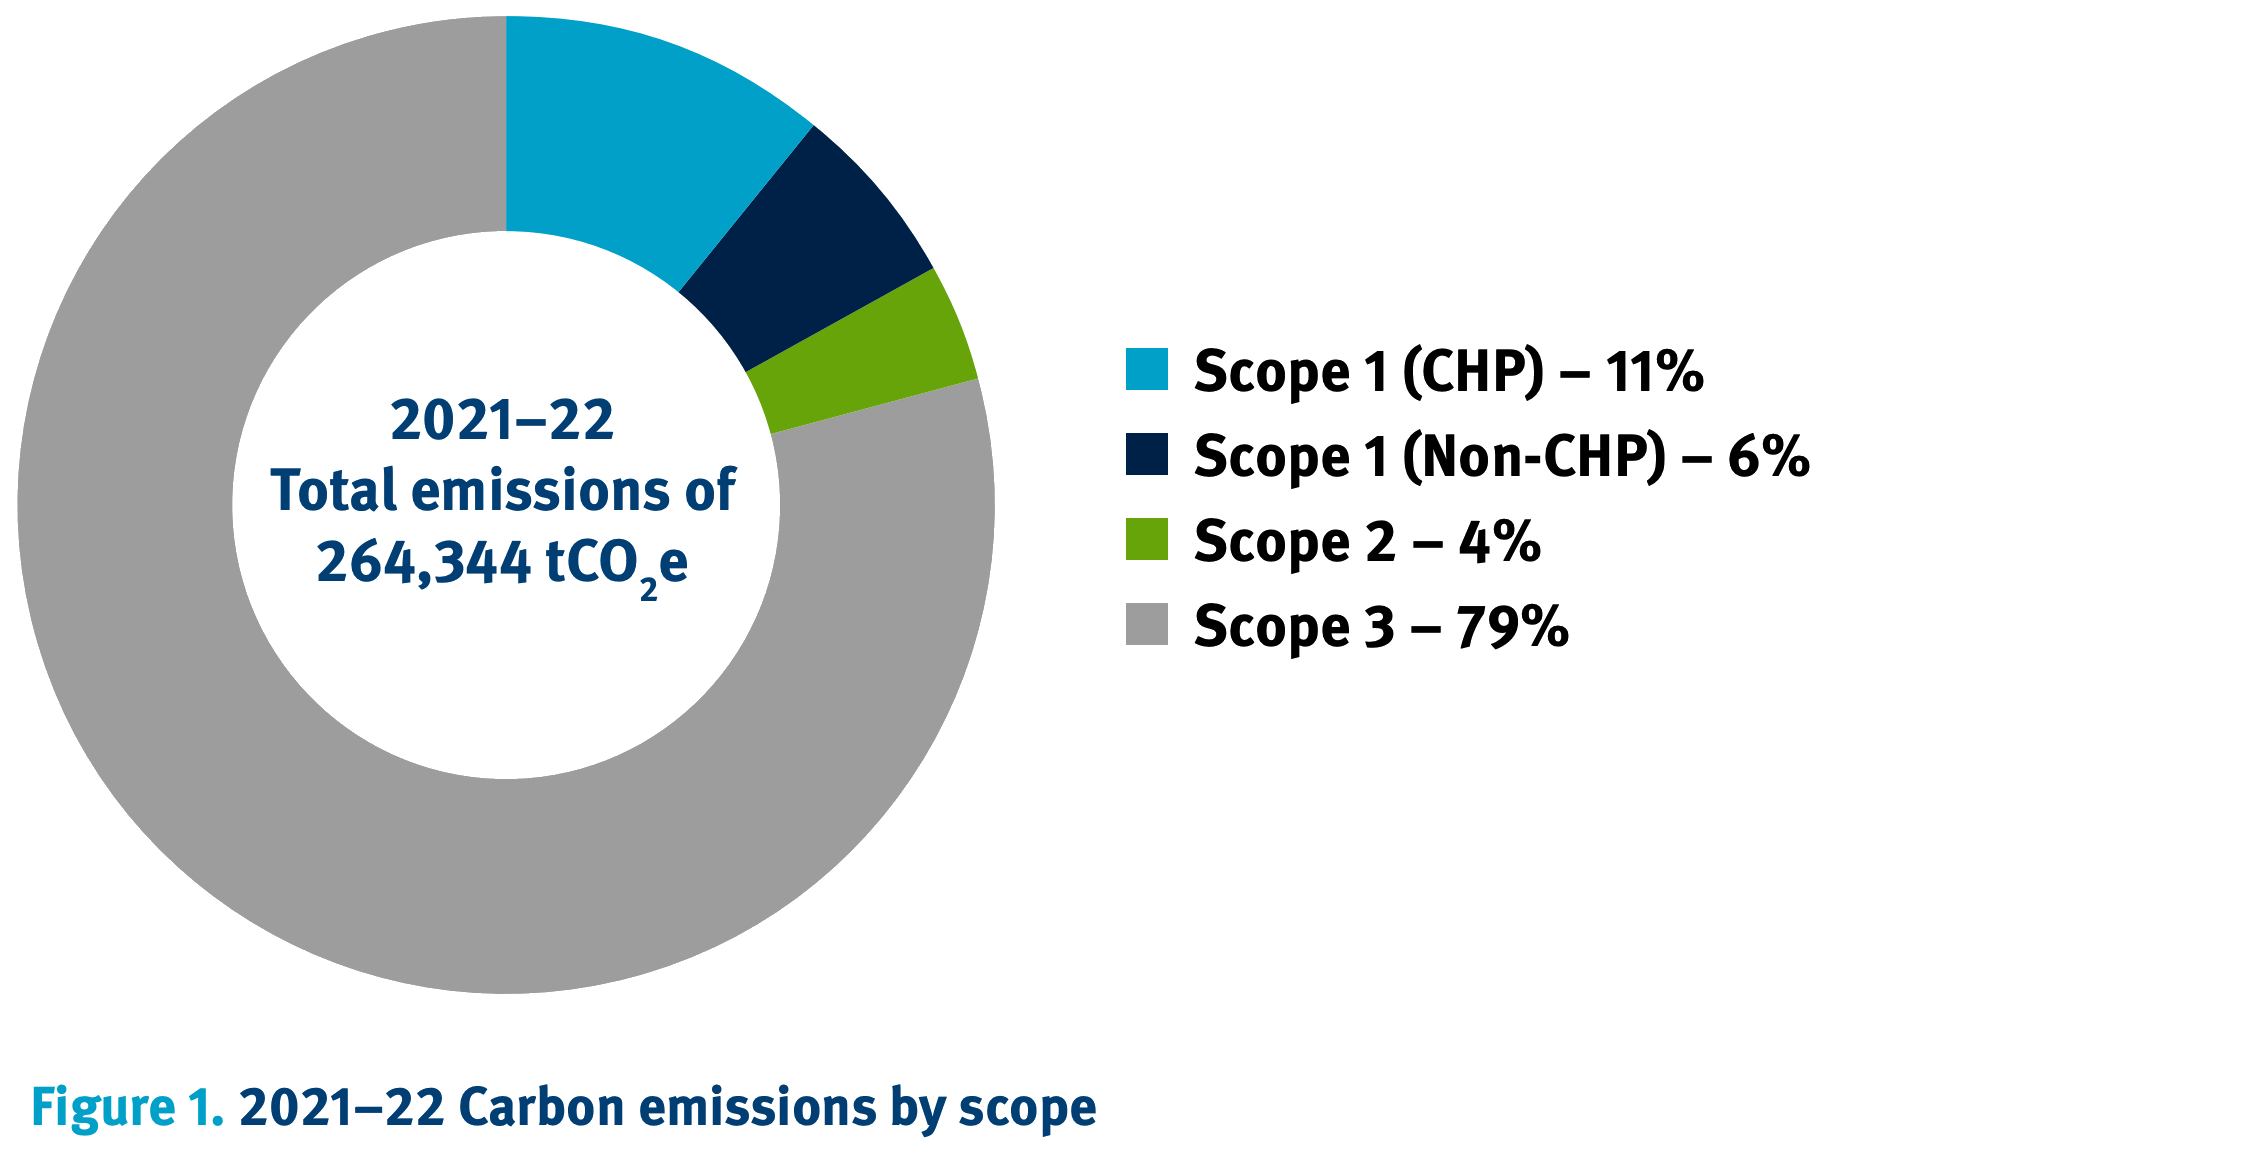
Since 2018/19, Imperial’s scope 1 & 2 emissions have changed by 0.00%. 2018/19 is the baseline year for Imperial’s strategy, meaning this 0.00% change is what the Carbon Report calls “making good progress” towards reducing emissions by 15% by 2025/26 (pg. 23).
Since 2018/19, Imperial has seen a 12.20% increase in the number of Full Time Equivalent (FTE) staff and students and a 5.23% increase in estate size, so Imperial’s emissions intensity by either metric has fallen. While this does show a genuine effort to reduce emissions, the university only has another 2.5 years to meet their target, so they will likely need to significantly speed up emissions reductions.
Both 2020/21 and 2021/22 were affected by the COVID-19 pandemic, when we saw reductions in per FTE and per m2 intensities. Imperial increased ventilation to reduce the chance of infection for those still working on campus. This meant they had to heat more air even though lectures were remote for some periods, which explains why we did not see a substantial decrease in emissions. Considering these years are the latest data, it is hard to reach strong conclusions about future emissions.
 Graph showing Imperial’s total scope 1 and 2 emissions from 2012/13-2021/22. Emissions have remained roughly constant since 2018/19. (From Imperial’s 2022 Carbon Report.)
Energy
The Carbon Report notes “that CHP engines are a relatively low-carbon technology, and we would have been responsible for greater overall carbon emissions had we raised heat in local gas boilers in each building and imported our electricity from the grid.” However, the data is now inconclusive: In 2015/16 the college was replacing their CHP engines and they generated no power. Despite this, the scope 1 & 2 emissions were about the same as other years. The Carbon Report acknowledges the need to move from CHP to renewable sources (pg. 05). When grid emissions factors were higher, CHP would have been cleaner than other options. As the grid continues to decarbonise, the case for CHP will be worse - especially as infrastructure is improved to make heat pumps more viable.
The balance between CHP and buying from the grid rests around the grid emissions factors (part of the UK grid greenhouse gas conversion factors2), which we can expect to continue to reduce as the UK approaches its 2050 net zero commitment.
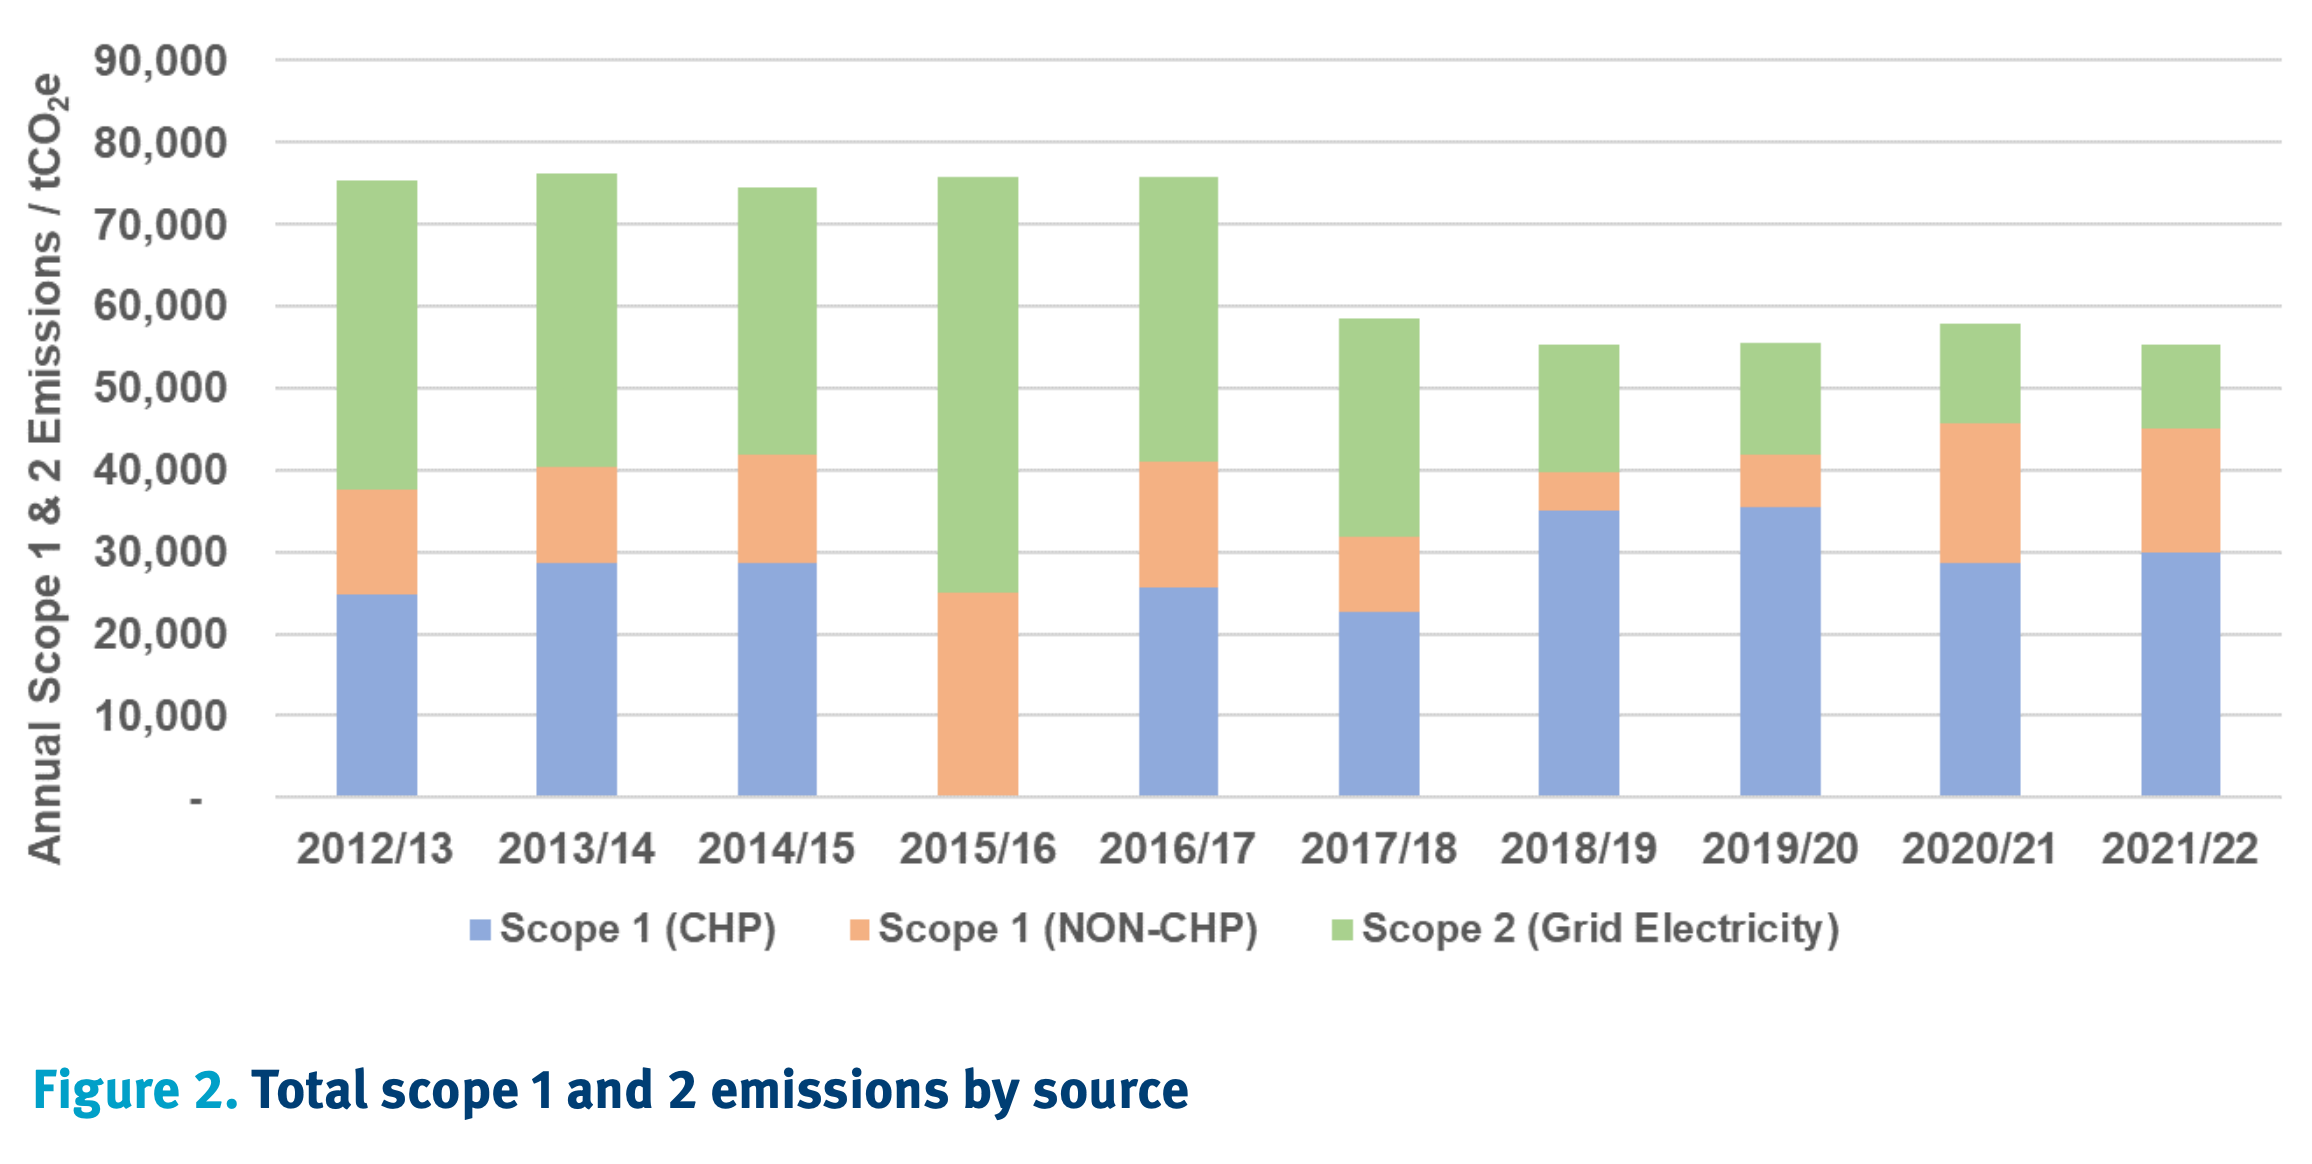
 Graph showing purchased electricity per full time staff and student equivalent from 2012/13-2021/22. Total energy purchasing has plateaued despite growth in FTE. (From Imperial’s 2022 Carbon Report.)
Estates
The consulting firm Arup produced a plan for South Kensington Campus and White City Campus which aligns them with the College’s 2040 net zero commitment (pg. 05). Changes to the fabric of Imperial’s estate (e.g. adding insulation) are limited by the age and variety of the buildings. The plan is to move to a hybrid approach using air source heat pumps with gas boilers as a backup for high load3. This allows the buildings to use lower carbon heating options without making the fabric-first changes that they might want to make.
Across campuses, Imperial is removing steam boilers and is trialling a heat pump. The College also has plans to introduce more LED lighting and retrofit buildings. On White City South Campus there will be no fossil gas and the use of sustainable materials should reduce the emissions of the Infrastructure Development Plan works by 28% compared to the initial proposals. White City Campus has also been designed to support more active travel, which is supported by asks from staff for more cycling and sustainable travel options.
The Arup strategy is in the process of being signed off by the Sustainability Strategy Committee, who should be able to share more details once this is complete.
Food
Food systems account for 21-37% of global emissions4. Most of these are scope 3 emissions for Imperial, arising from raising and feeding the animals. Imperial’s food purchases emitted 146 tCO2e in the 2022-23 financial year5.
I used the Imperial Catering Department’s procurement from the same time frame to show 146 tCO2e is probably accurate6. This was a surprisingly small amount of College’s total emissions but hopefully we’ll get more detail on the calculation in future sustainability reports.
Imperial’s Sustainable Food and Drink Policy sets out targets in line with their 2021-26 Sustainability Strategy. Most notably, the policy sets a target to reduce beef 35% annually to 0 in 2025/26, and lamb in line with that. Beef herds emit 99 kgCO2e/kg of beef and lamb 40 kgCO2e/kg - the two highest emissions intensities among major foods7. Meat, poultry, and offal cover about 35% of Imperial’s food emissions so policies here are significant.
Imperial’s targets are hopefully made easier to achieve by the fact that ~80% of students are willing to take up more of the sustainable food and drink options on offer.
Scope 3
Harriet Wallace, Sustainability Strategy Director, presented at a recent MRC seminar some more details on Imperial’s scope 3 emissions. The indicative breakdown of scope 3, which is 79% of Imperial’s total, is:
- 30% - ICT goods and services
- 20% - Lab purchases
- 20% - Business services
- 15% - Capital expenditure (incl. lab kit)
- 7% - Business travel
Of the ICT footprint, ~8,000 tCO2e is from purchasing equipment and the other ~20,000 tCO2e is from software and associated servers. The electricity required to run equipment usually falls under scope 2, and Imperial is checking they’ve avoided double counting here.
Of the 7% of scope 3 emissions attributed to business travel, 95% comes from air travel. Imperial has committed to reducing emissions from air travel per person by 25% by 2026 relative to 2018/19. They also recognise the importance of climate conscious travel: meeting online where possible and taking trains where it is not. Students and staff recognise the importance of this too with over 80% saying they would be willing to adopt a more climate-conscious approach to travel.
Scope 3 is by far the most difficult scope to track since it involves all the emissions created by products and services bought. Imperial is still working on calculating their scope 3 emissions (which is probably we don’t have historical data or many commitments here yet). I’ll keep you updated as we get more data on this.
This year Imperial came 98th in the People & Planet University League: scoring 50% in environmental policy, 25% in carbon management, and 32.5% in carbon reduction putting us at the very bottom of 2:2 class universities. By comparison, King’s College London came 5th overall, receiving 100% in environmental policy, 80% in carbon management, and 77.5% in carbon reduction. Clearly we have a long way left to go.
I’m impressed by the rigour and care being taken by Imperial when it comes to calculating their emissions. They’ve set several ambitious targets and I’m excited to see them met. Sustainability work is always subject to scrutiny and we will only help by continuing to push for more action and showing ambition and enthusiasm.
“Arrogance has brought us to the brink. The laws of nature will bring us to our knees. And then perhaps we will see the mosses.”
- Robin Wall Kimmerer
Signing off from the dreams of a young, maybe old, planet,
Oscar Mitcham
-
Imperial Zero Pollution. Carbon Management and Sustainability Activities Report 2020-22. https://www.imperial.ac.uk/media/imperial-college/about/sustainability/Imperial-Carbon-Report-2022.pdf. ↩
-
Which can be found in the gov.uk collection of conversion factors https://www.gov.uk/government/collections/government-conversion-factors-for-company-reporting. ↩
-
Imperial College London, Estates Operations. People Places Spaces December 2023. https://www.imperial.ac.uk/media/imperial-college/administration-and-support-services/estates-facilities/public/Winter-23-online-(PDF).pdf (pg. 08). ↩
-
Mbow, C., C. Rosenzweig, L.G. Barioni, T.G. Benton, M. Herrero, M. Krishnapillai, E. Liwenga, P. Pradhan, M.G. Rivera-Ferre, T. Sapkota, F.N. Tubiello, Y. Xu, 2019: Food Security. In: Climate Change and Land: an IPCC special report on climate change, desertification, land degradation, sustainable land management, food security, and greenhouse gas fluxes in terrestrial ecosystems [P.R. Shukla, J. Skea, E. Calvo Buendia, V. Masson-Delmotte, H.-O. Pörtner, D.C. Roberts, P. Zhai, R. Slade, S. Connors, R. van Diemen, M. Ferrat, E. Haughey, S. Luz, S. Neogi, M. Pathak, J. Petzold, J. Portugal Pereira, P. Vyas, E. Huntley, K. Kissick, M. Belkacemi, J. Malley, (eds.)]. In press. ↩
-
Imperial’s response to my food systems Freedom Information Request is available at https://www.imperial.ac.uk/admin-services/secretariat/information-governance/freedom-of-information/disclosure-log/college-estates-and-facilities/ ↩
-
My rough calculations can be found here. I only wanted to check Imperial’s figure was order-of-magnitude levels of accurate, which it seemed to be when assuming I had overestimated the impact of their largest meat and dairy purchases by 5x. ↩
-
Poore, J., & Nemecek, T. (2018). Reducing food’s environmental impacts through producers and consumers. Science. – processed by Our World in Data. “Greenhouse gas emissions per kilogram” [dataset]. Poore, J., & Nemecek, T. (2018). Reducing food’s environmental impacts through producers and consumers. Science. [original data]. (Available at: https://ourworldindata.org/explorers/food-footprints) ↩